Open source V6 beta

PaperSpine · An AI for Science
Skill for your agent

Call $paper-spine in chat. Start with a question, data, or a draft and build an editable paper whose key claims can be checked against the evidence.

Install PaperSpine

Start with one Skill in chat. Choose the Skills Pack to call stages separately, or add the optional local review interface on Windows.

Install with your AI

Paste this request into the AI agent you use for research.

Install PaperSpine for this host. Read the official guide first. https://wubing2023.github.io/PaperSpine/v6/llms.txt Choose the edition that fits my task and environment. Verify the ZIP with SHA-256. After installing, confirm the version and tell me how to invoke the Skill.

Quick Start

Full Workflow Skill

Give your host a research question, a results folder, or a draft. Call $paper-spine and agree on the next research or writing step.

What you get

Research notes, analyses or documented evidence, figures, and an editable manuscript for the scope you set.

$paper-spine

Skill-capable host
283 KiB

Download ZIP

For Research Experts

Skills Pack

Install the full workflow and five skills you can invoke individually. Start with existing evidence when you only need to revise a section or check a figure.

What you get

A focused output such as a reference-guided rewrite, an editable figure, a review report, or a paper archive.

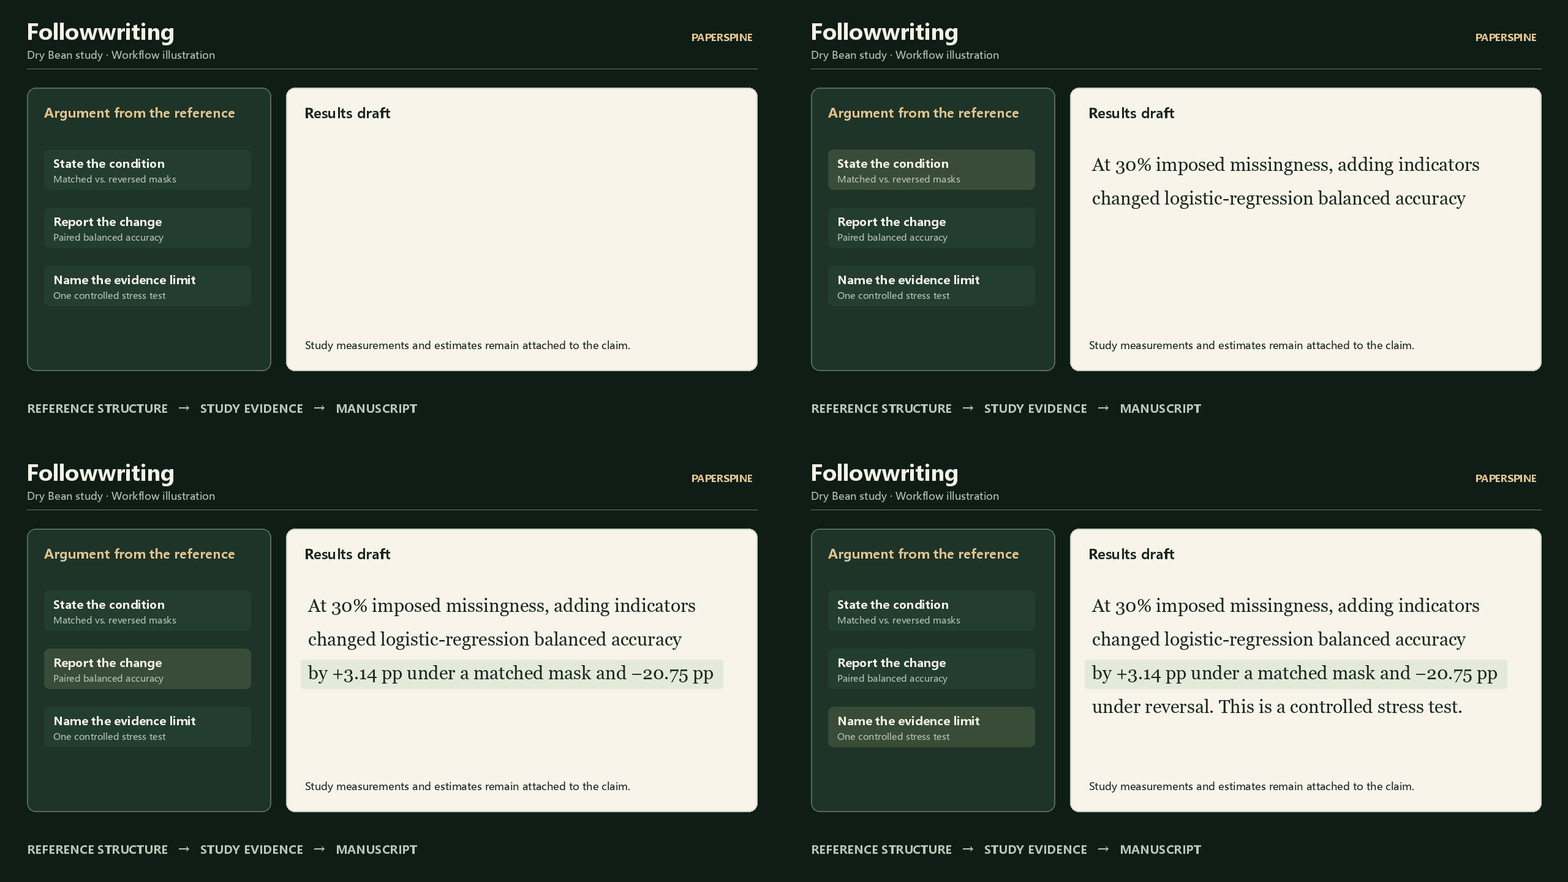
$paper-spine-followwriting

Skill-capable host
283 KiB
Download ZIP

Full Workbench

Web Plugin

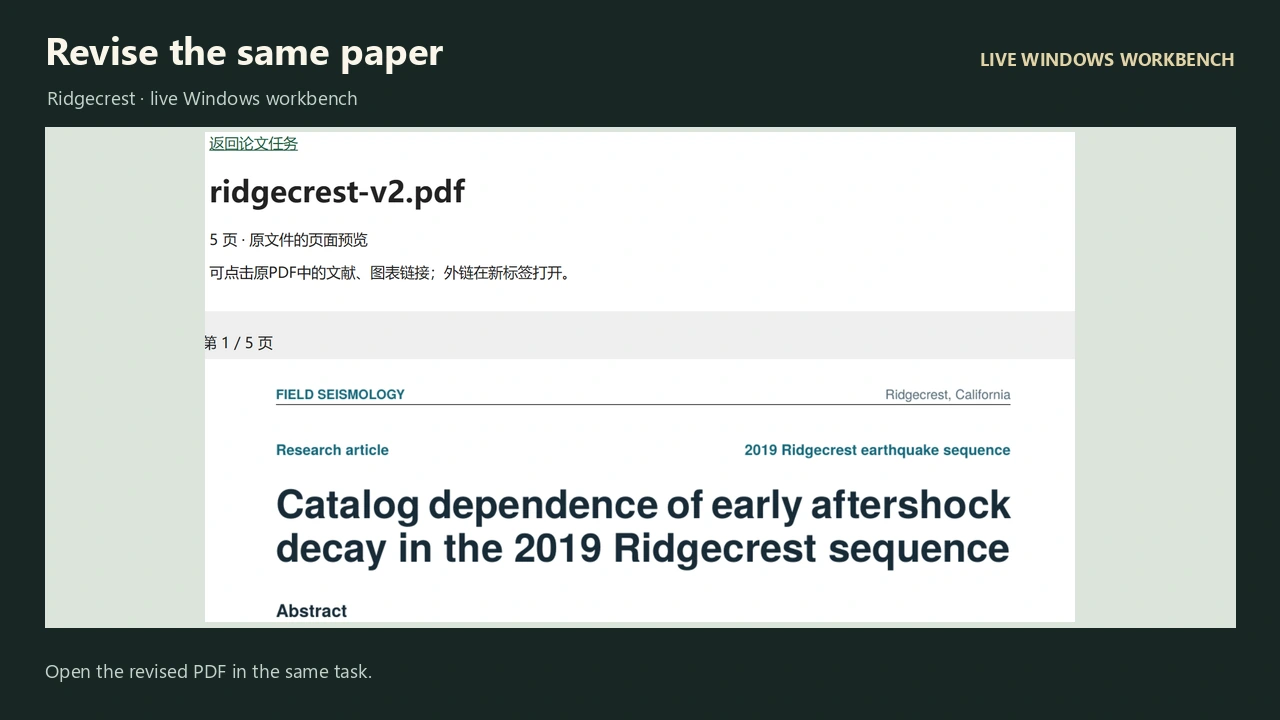
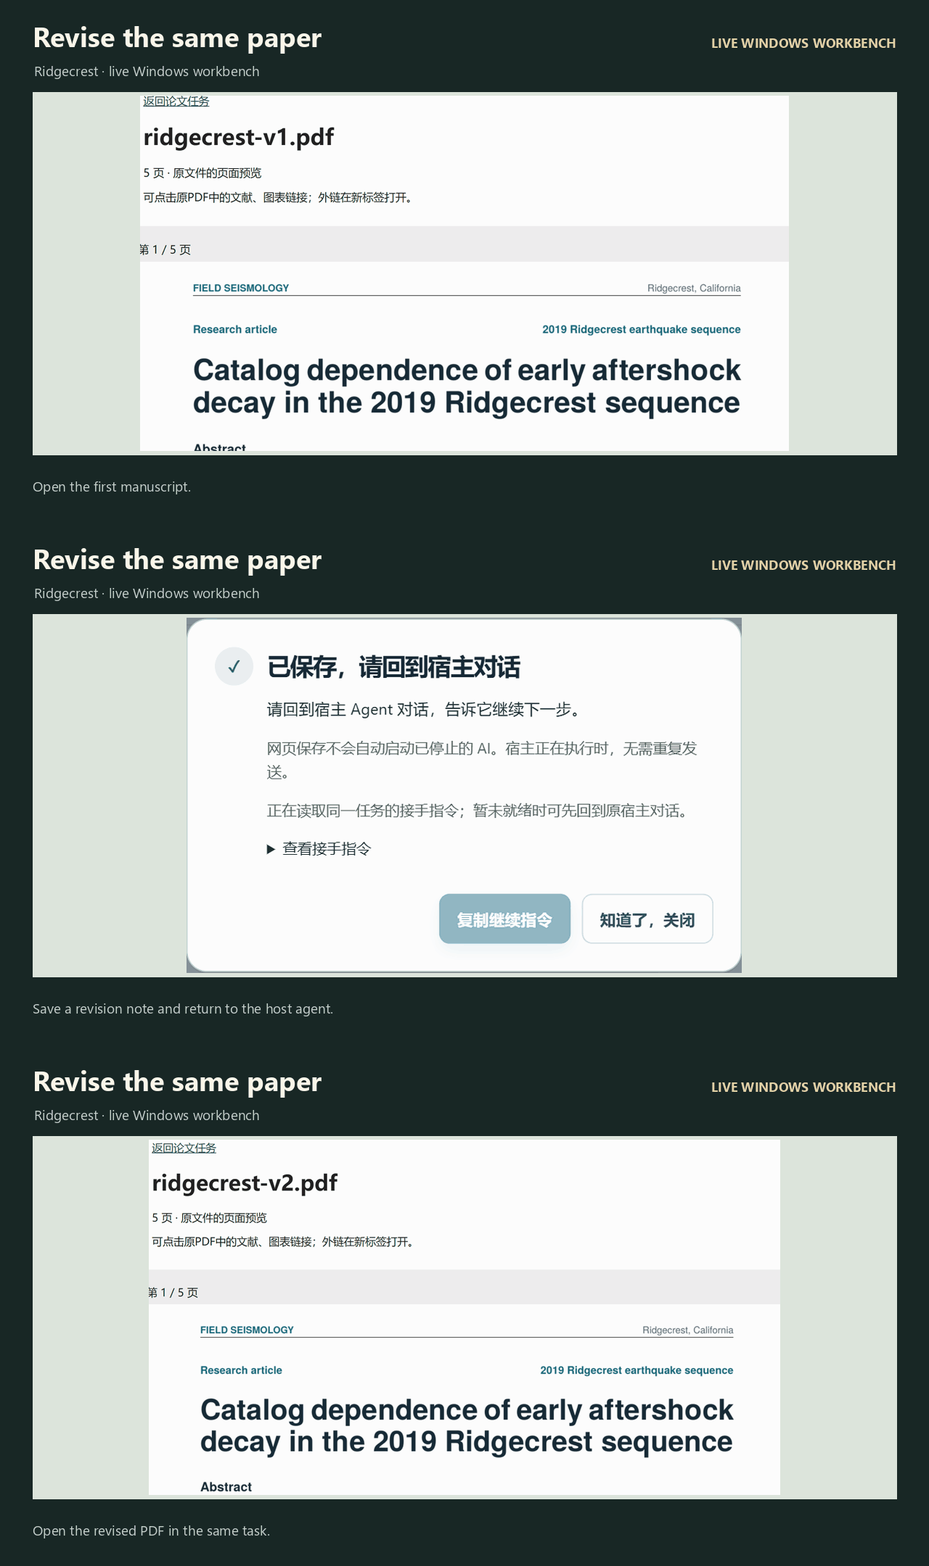
Open a paper with the host, then use the workbench to save settings, compare figures, preview files, and respond with revision notes.

What you get

A local record of selections, feedback, previews, and the same paper’s downloadable files.

$paper-spine-web:paper-spine-web

Windows x64 · Codex
25.93 MiB

Download ZIP
What can I ask PaperSpine to do?
  • Full Workflow Skill. “Use these measurements to design a paired analysis. Save the code and figures, then write an editable manuscript.”
  • Skills Pack. “Use my results and the two attached reference papers to revise the Results section. Keep the estimates and claim scope.”
  • Web Plugin. “Open this study in the workbench so I can inspect the figure, preview the draft, and send a revision note.”

Use the install manager to update or roll back the installed edition. Uninstalling keeps your research files and local tasks.

Research you can inspect.

From Atlantic cyclone tracks to LIGO strain, earthquake catalogs, and wildfire smoke. Each paper links to its data, editable manuscript, vector figures, and analysis code.

Atmospheric science · NOAA NHC

Rapid intensification across comparable starts

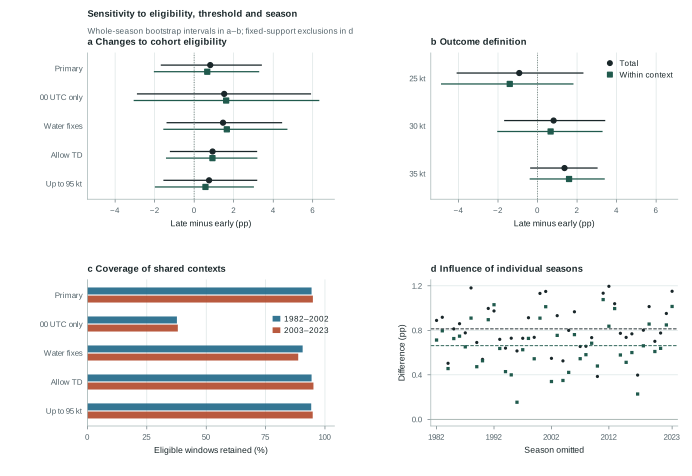
42 seasons, 6,017 eligible windows in shared starting contexts, and 2,400 whole-season bootstrap draws. Follow the 484 recorded rapid-intensification tracks, the three disjoint gain bands, and the contrast across nine thresholds.

The 30-knot estimate is +0.81 percentage points (95% interval −1.69 to +3.43). The sensitivity figure shows how the comparison changes with threshold and cohort.

Six-panel Atlantic cyclone figure with 484 recorded 24-hour tracks, disjoint gain bands, a threshold profile with uncertainty, and starting-context and seasonal comparisons.

Astrophysics · LIGO / GWOSC

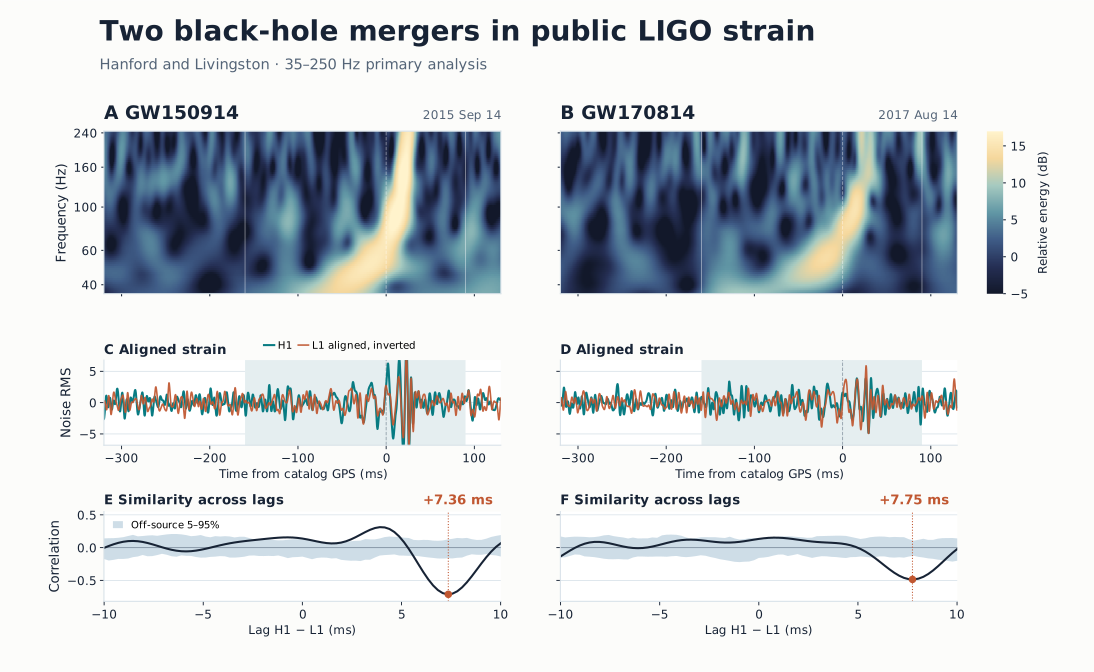
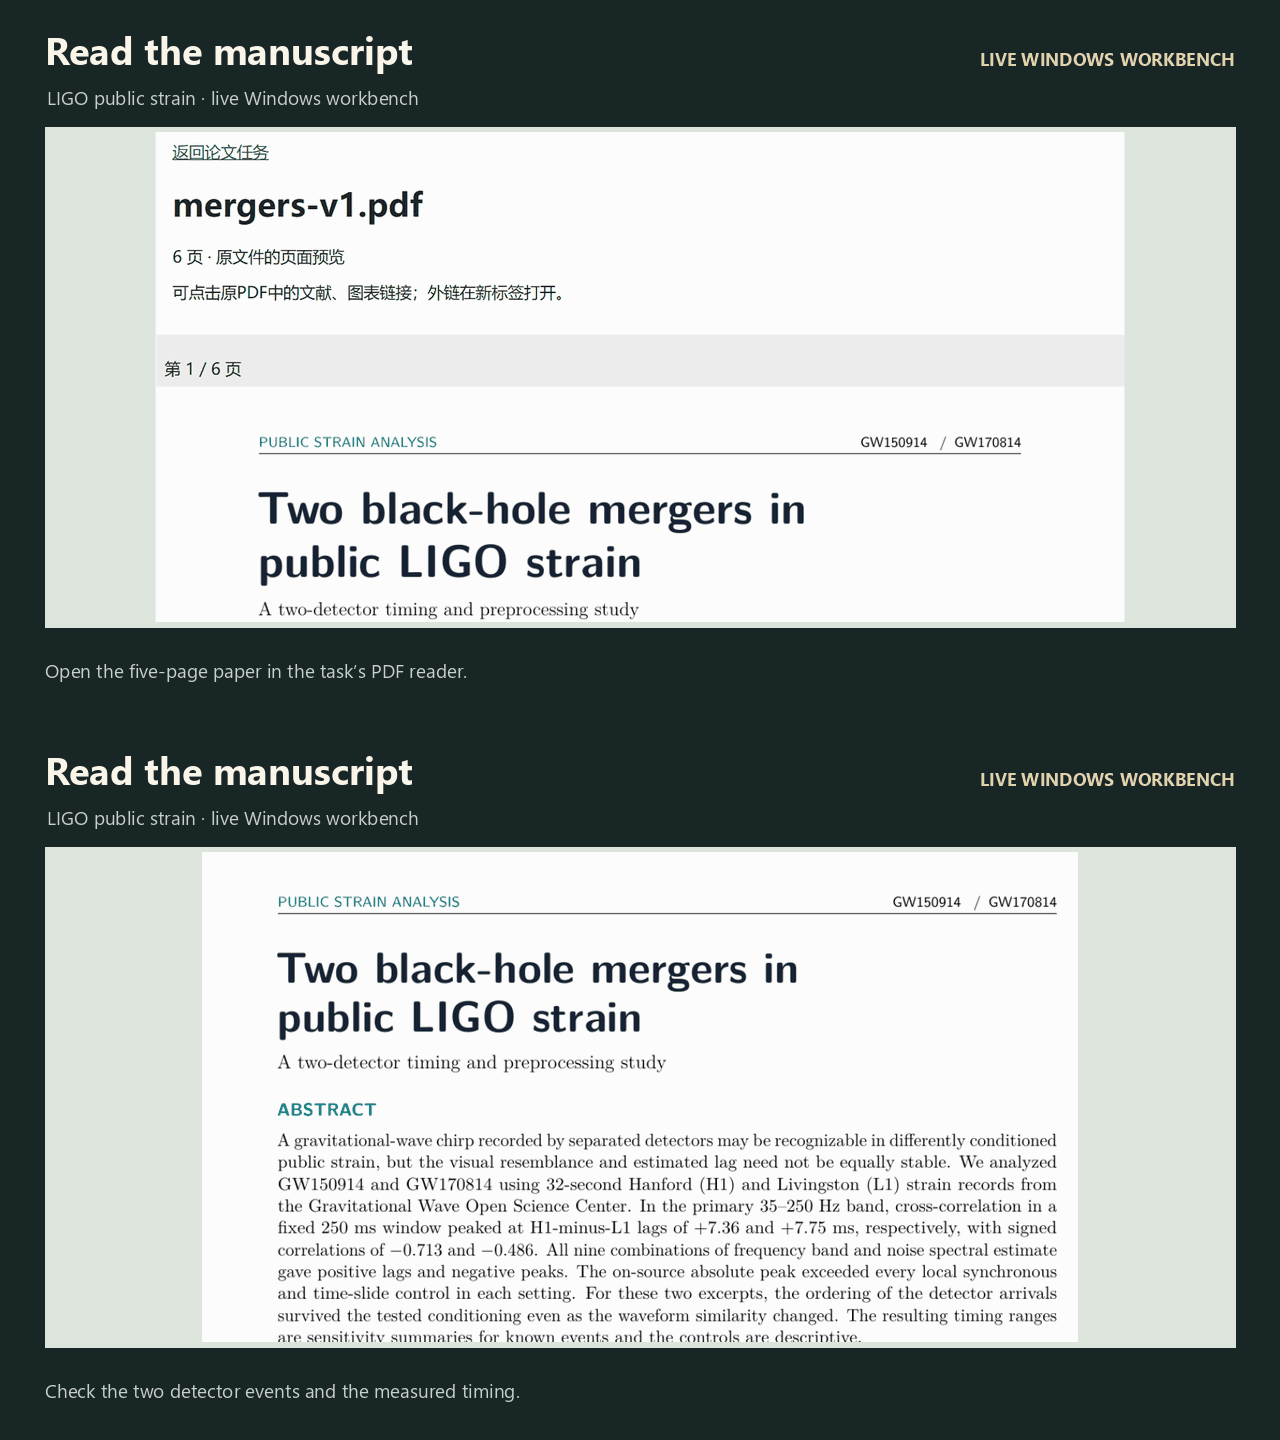
Two black-hole mergers, millisecond timing

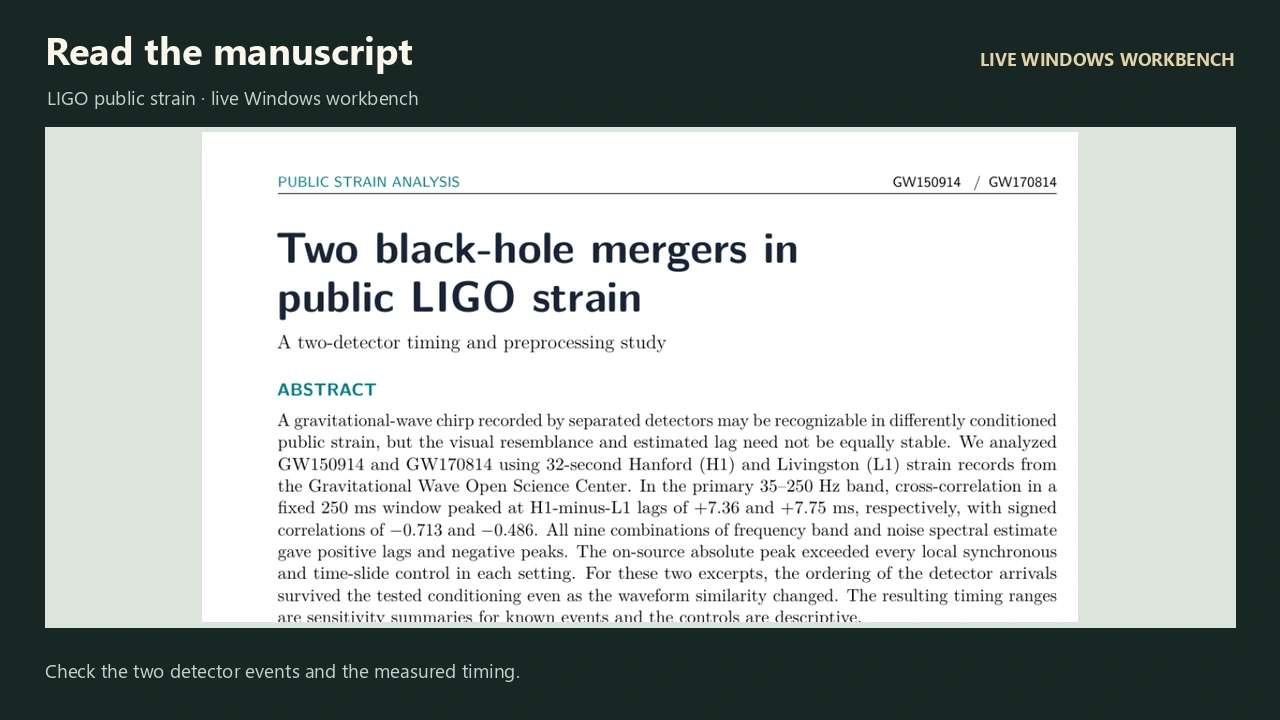
GW150914 and GW170814 public H1/L1 strain. Common lag-search range, off-source controls and a preprocessing sensitivity grid.

Hanford lagged Livingston by 7.36 and 7.75 ms in two public LIGO events. Both lag signs held across nine preprocessing choices.

Six panels showing measured time–frequency structure, both detectors’ aligned strain, and off-source lag comparisons.
Vector figure ↗

Seismology · USGS Ridgecrest

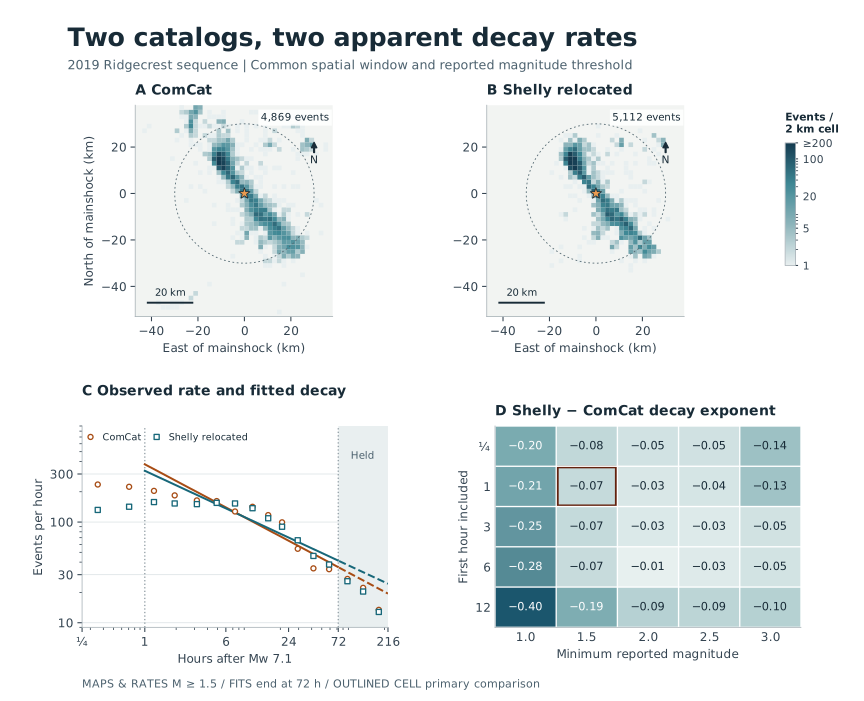
Aftershock decay depends on the catalog

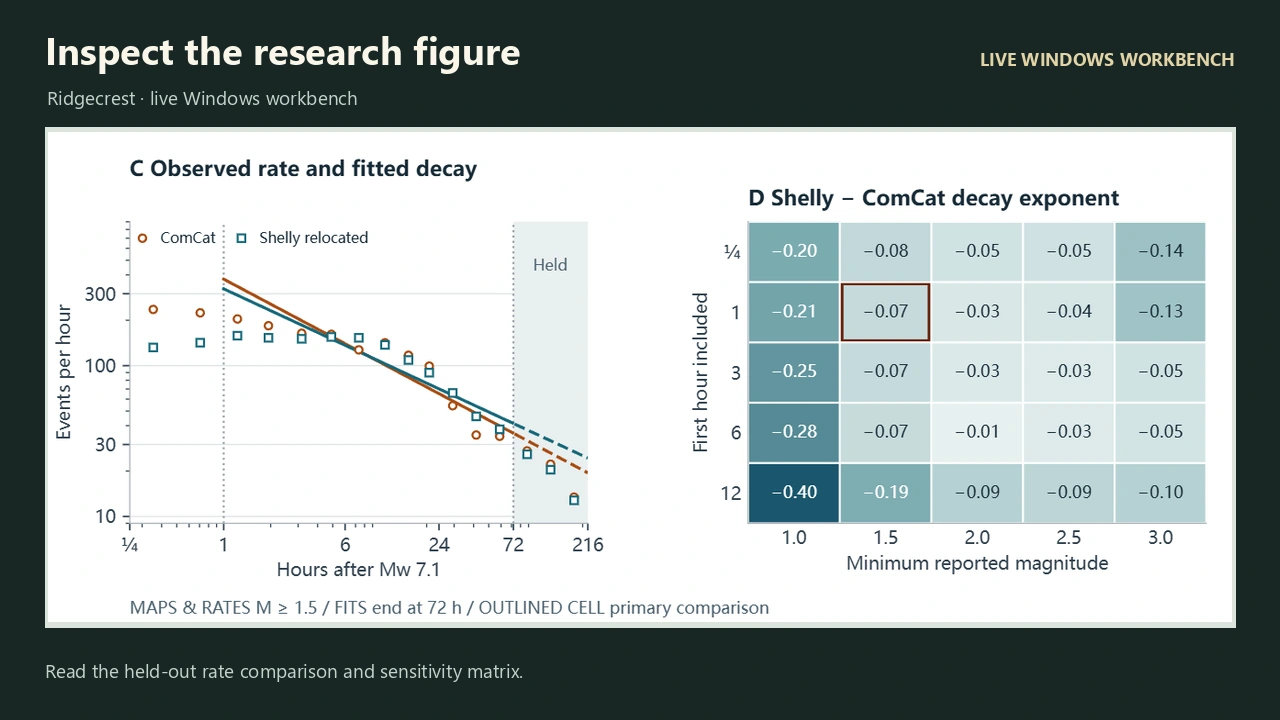
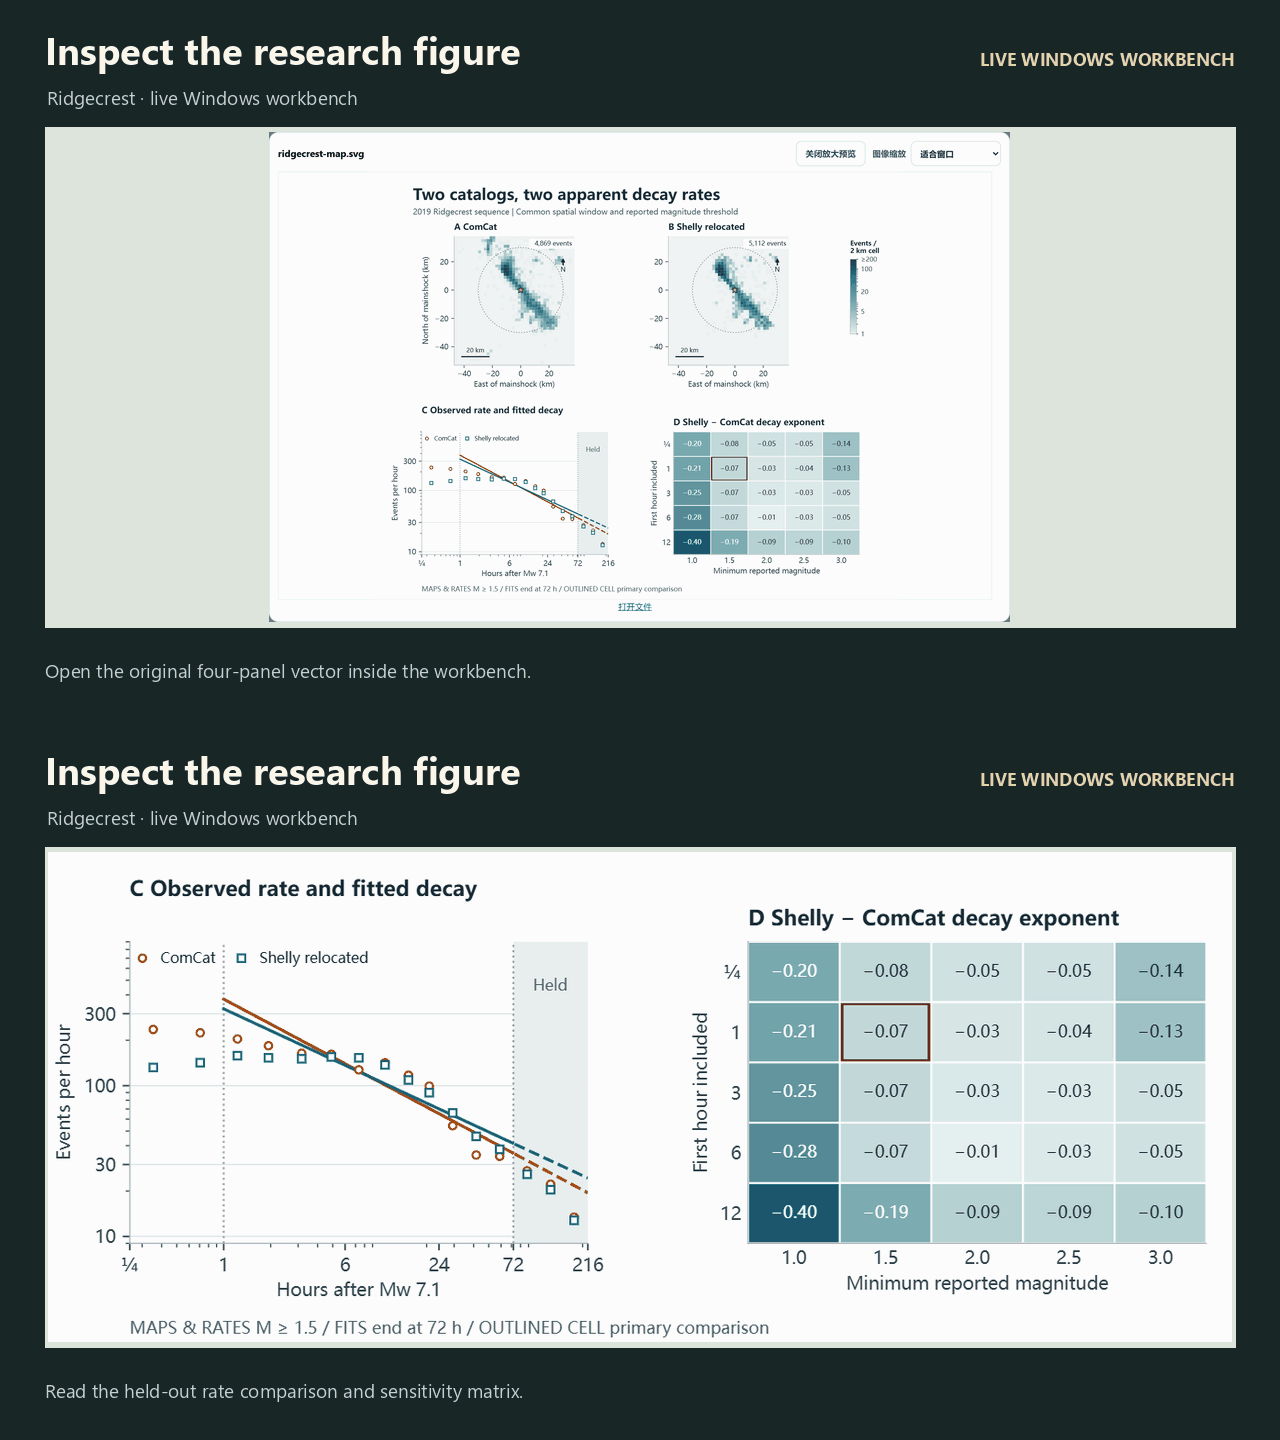
Two event catalogs on a shared space and time grid. Compare the fitted decay before testing a held-out interval and 25 pairs of thresholds and start times.

At reported M ≥ 1.5 and 1–72 hours after the Mw 7.1 event, fitted decay exponents were 0.55 in ComCat and 0.48 in the relocated Shelly catalog.

Matched epicenter density maps, a fitted rate comparison with a held-out interval, and sensitivity to magnitude and start time.
Vector figure ↗

Atmospheric science · EPA AirData

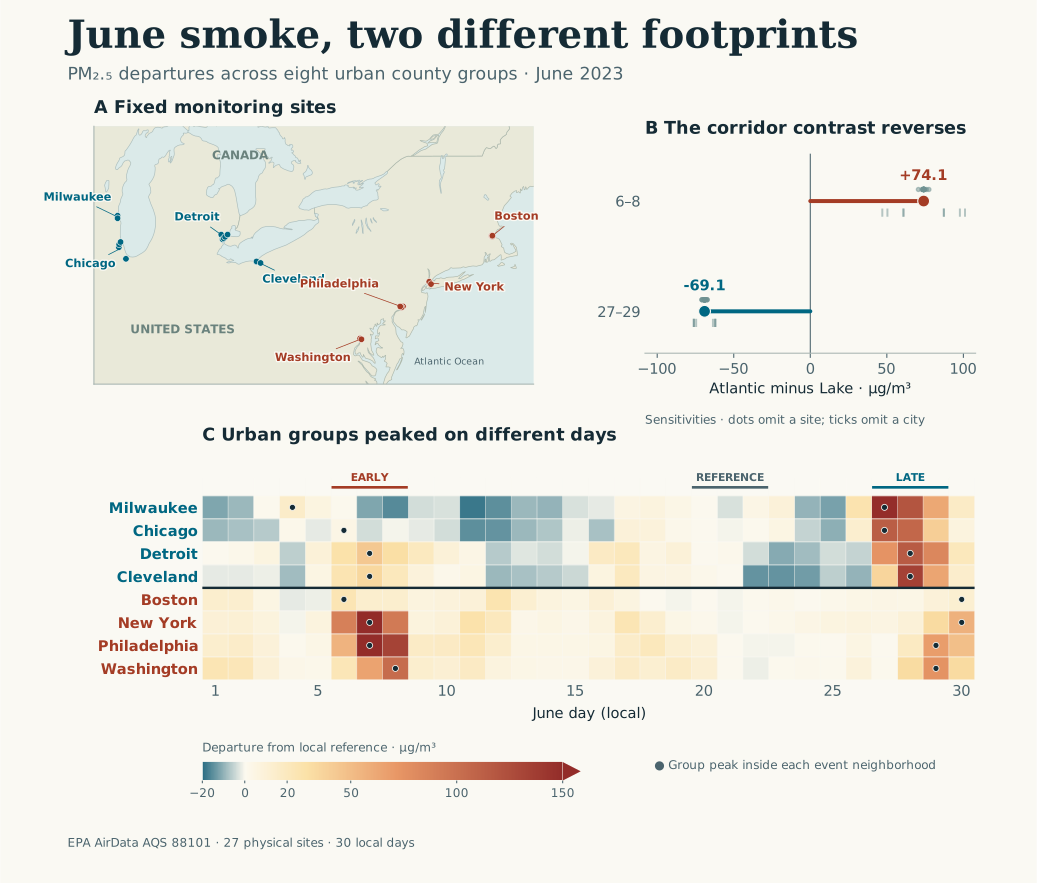
June smoke, two different footprints

27 monitors, eight county groups, and 810 site-days. A fixed monitor panel compares two June 2023 episodes with alternate reference and leave-one-group checks.

The Atlantic–Great Lakes PM₂.₅ departure reversed from +74.1 µg/m³ on June 6–8 to −69.1 µg/m³ on June 27–29.

A map of EPA monitors, paired corridor contrasts and a June calendar of PM₂.₅ departures above and below each site’s reference.
Vector figure ↗
Open earlier studies and figures

Earlier studies and figure examples

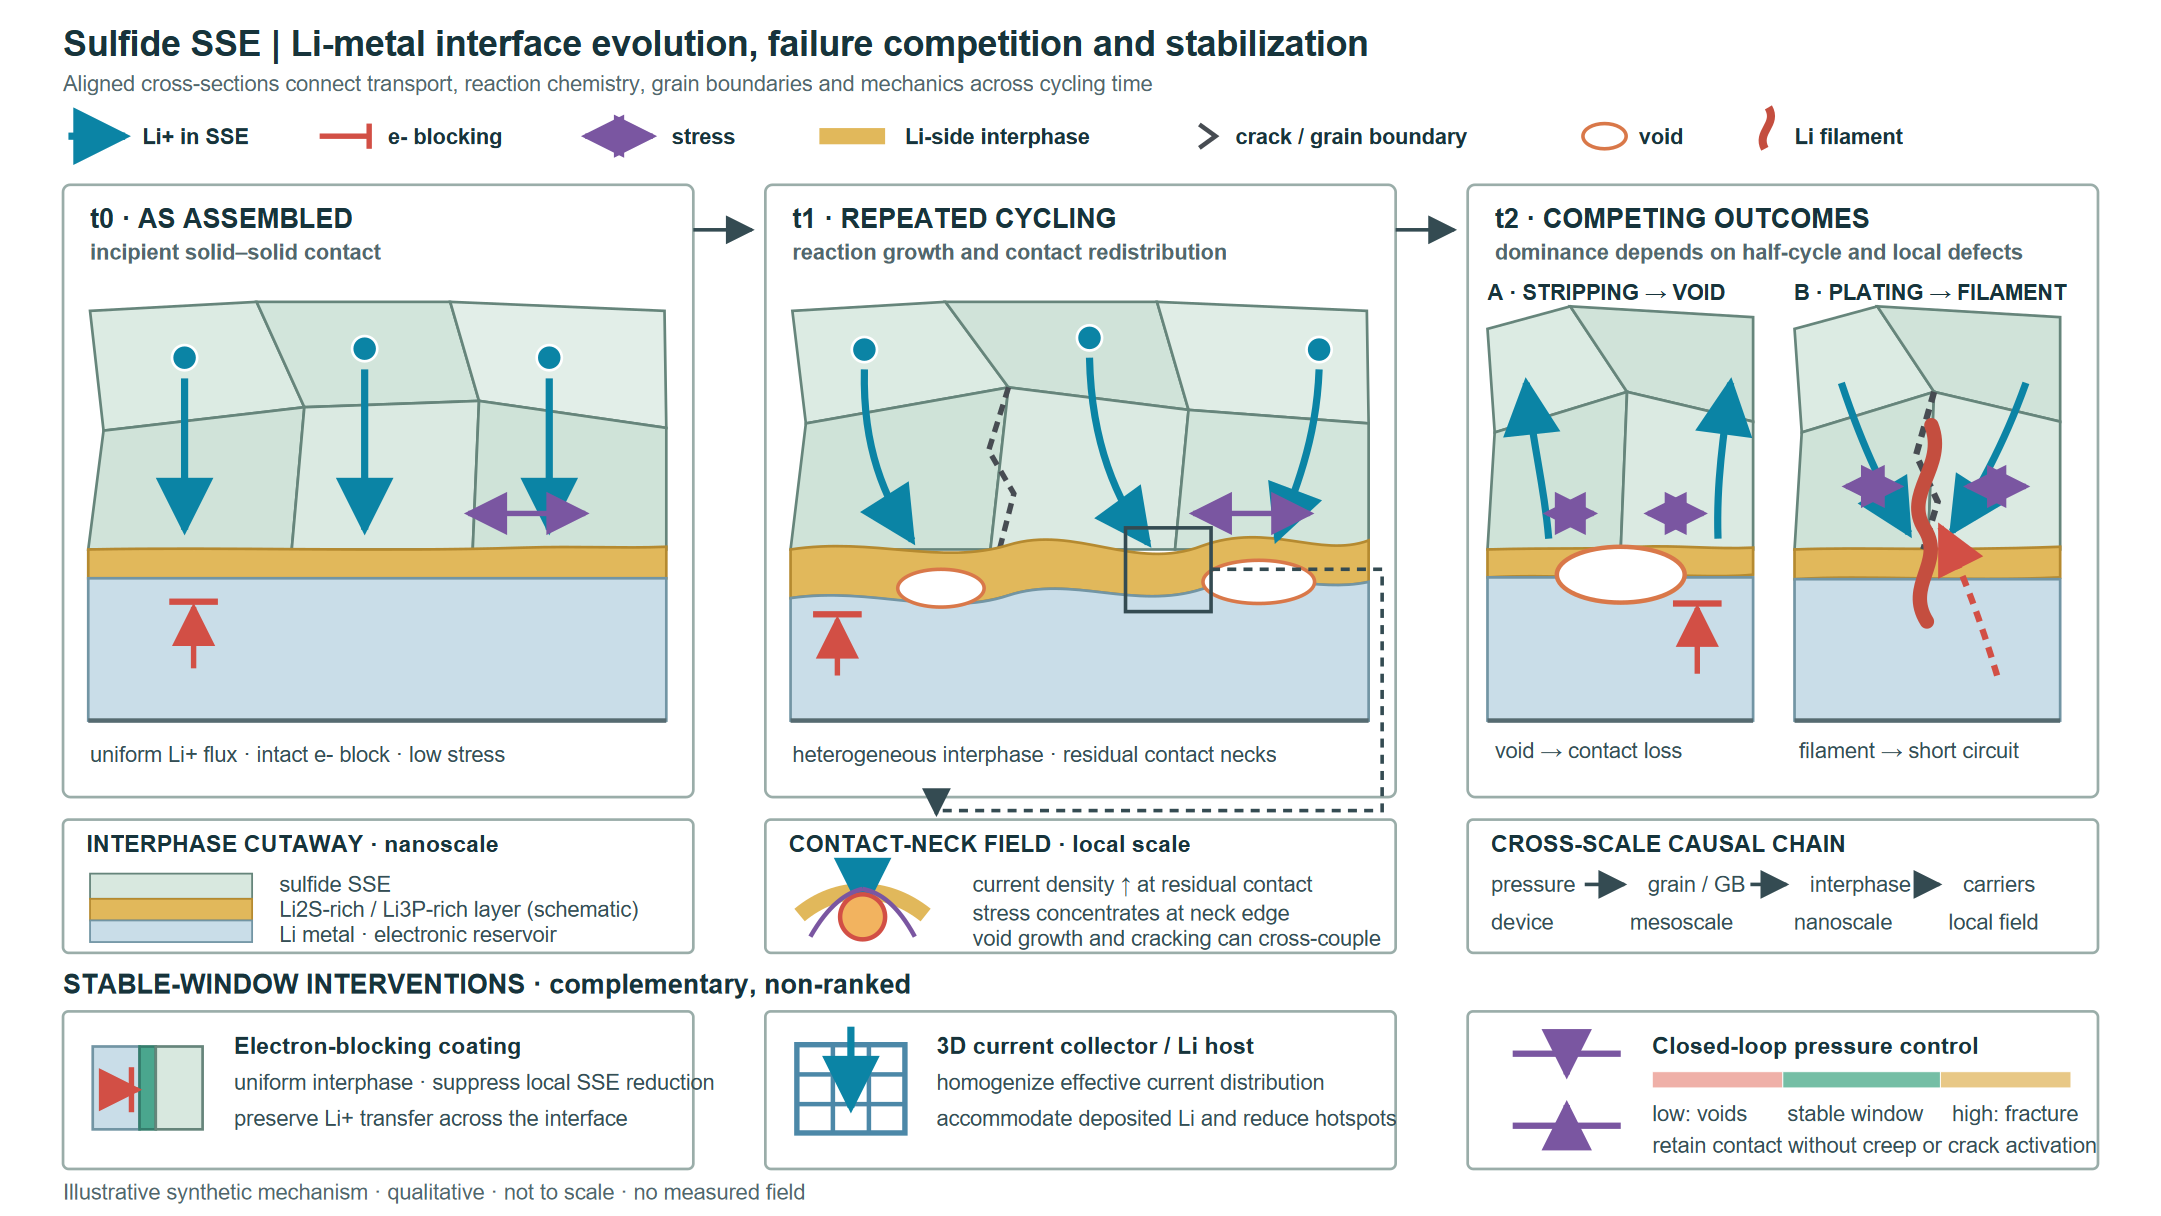
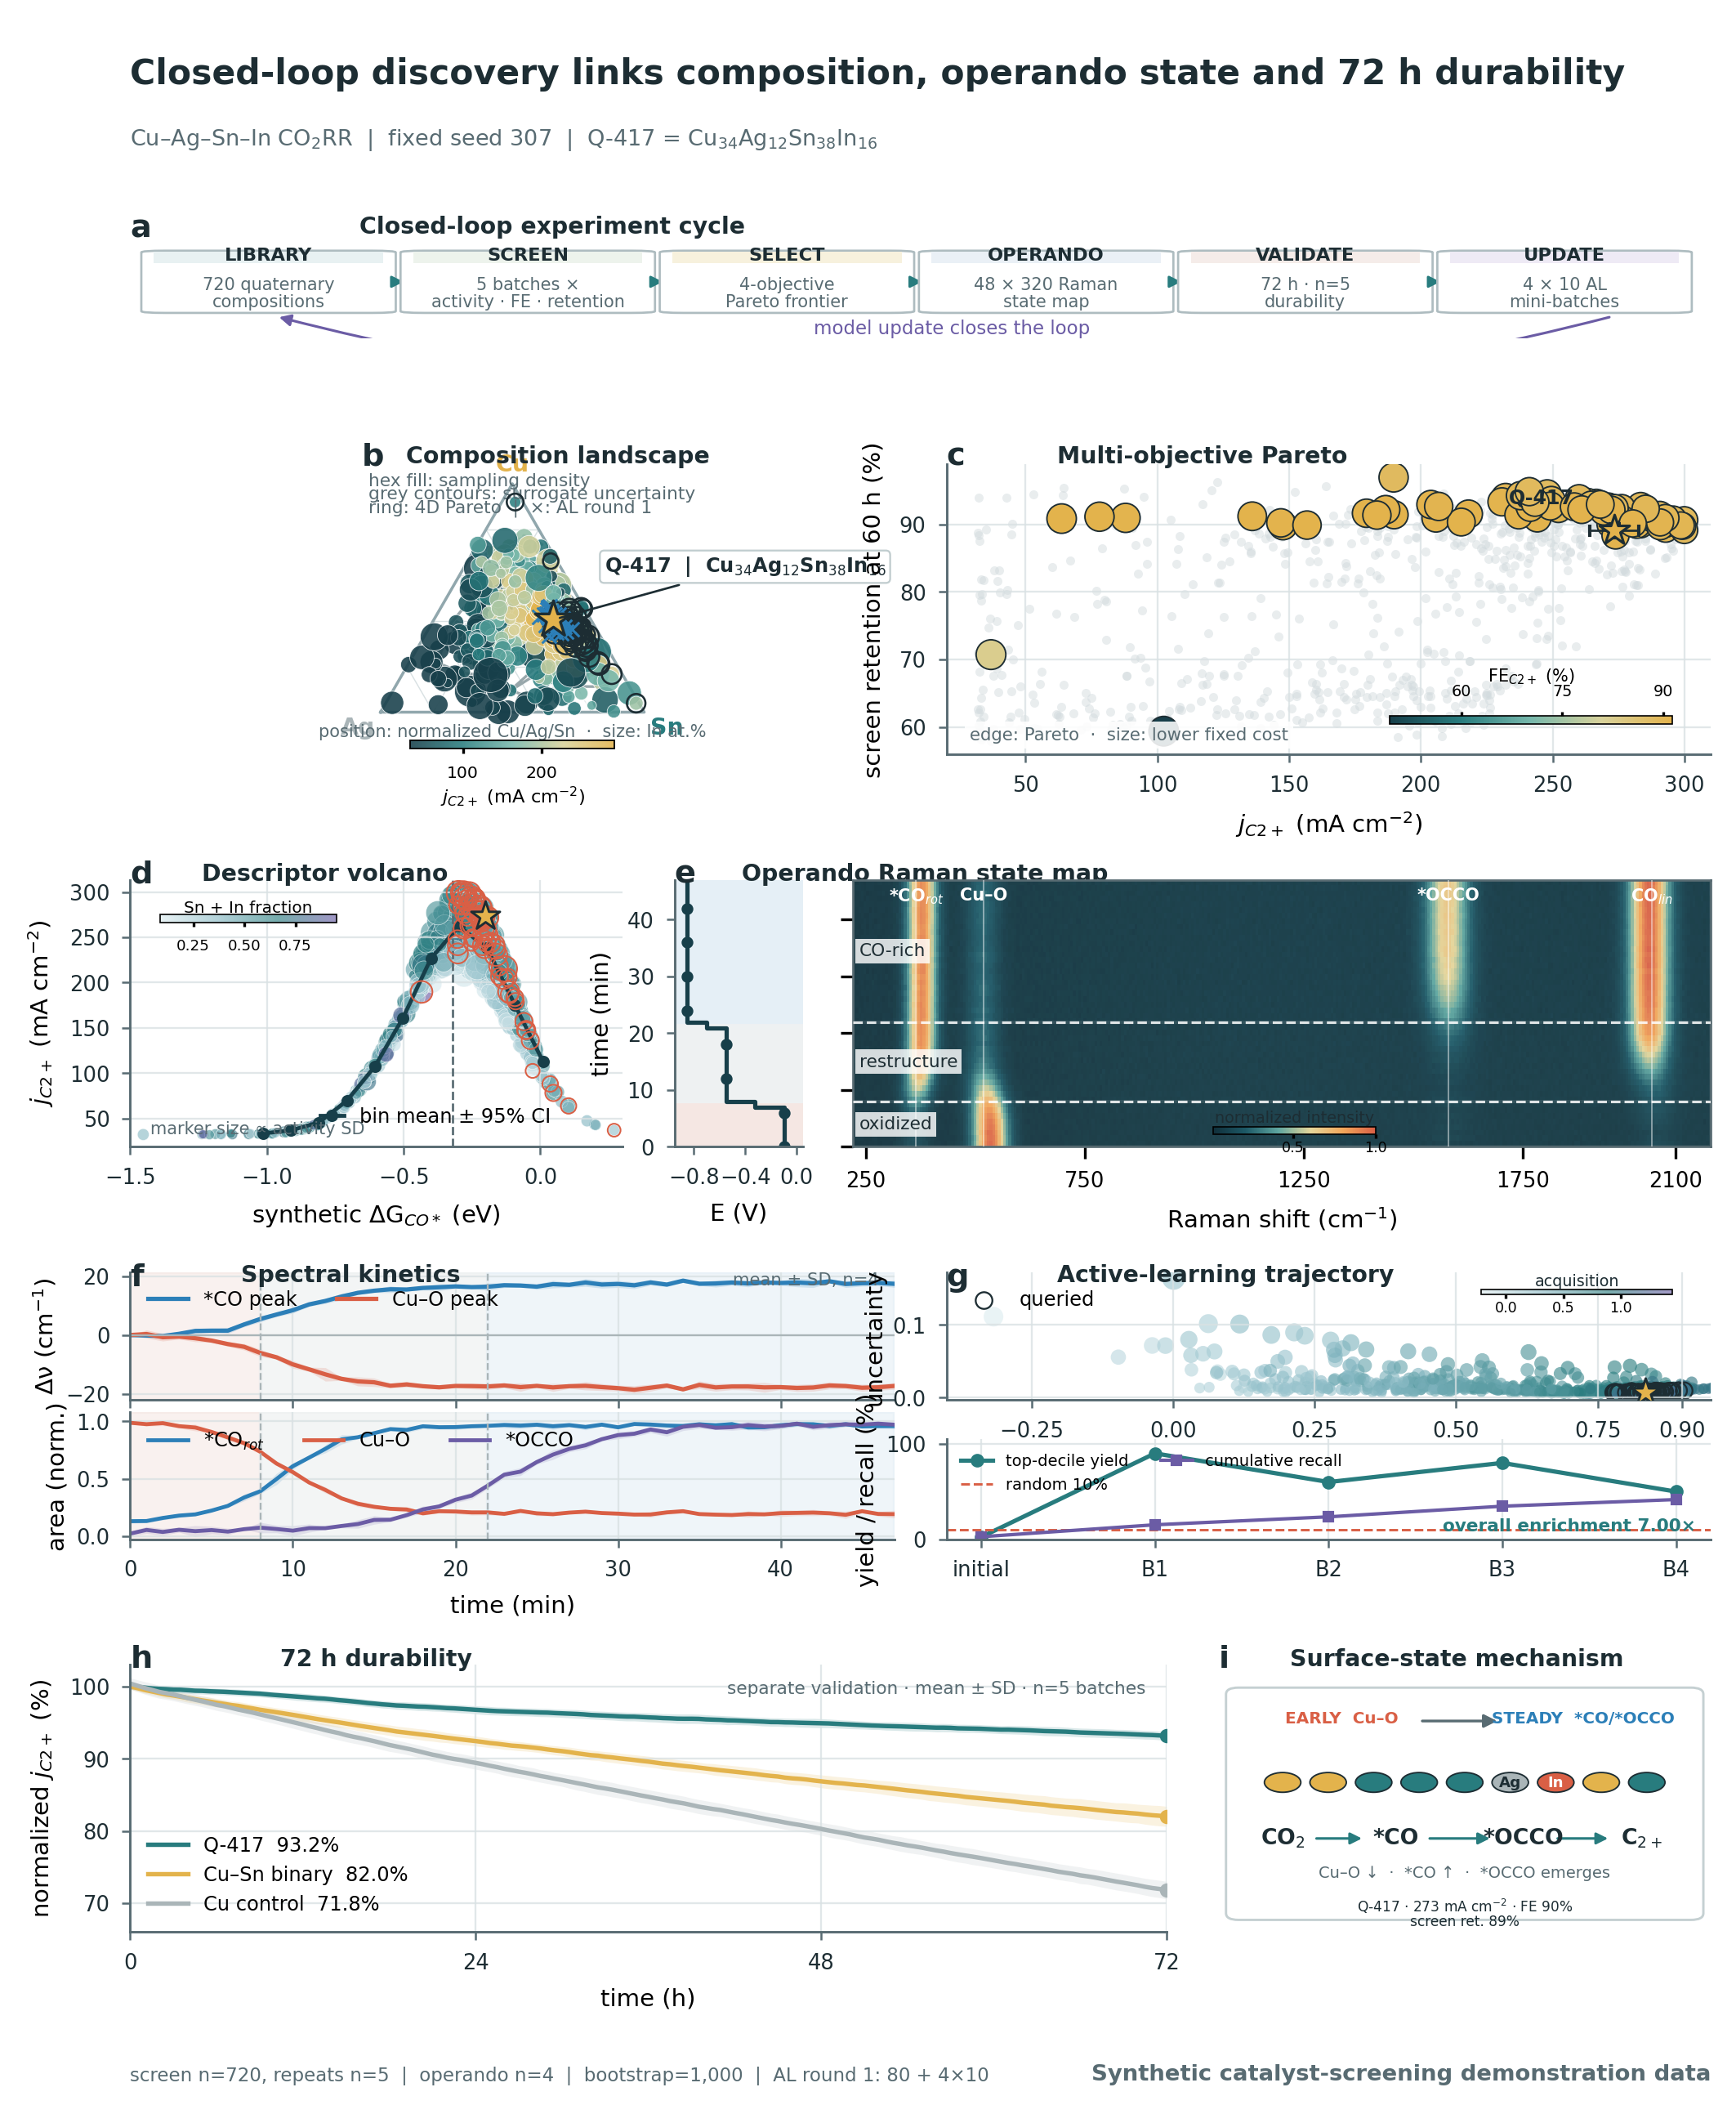
Two documented research runs, with their manuscripts and original figures. A separate figure gallery shows examples from materials science and catalysis.

Controlled stress test · Public measurements

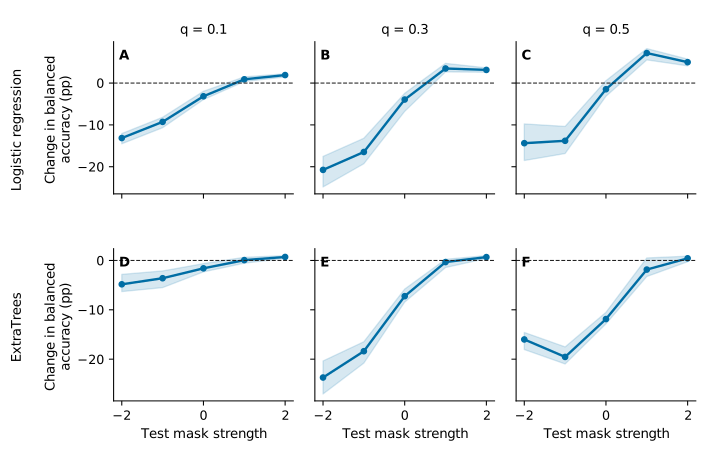
When missingness becomes a shortcut

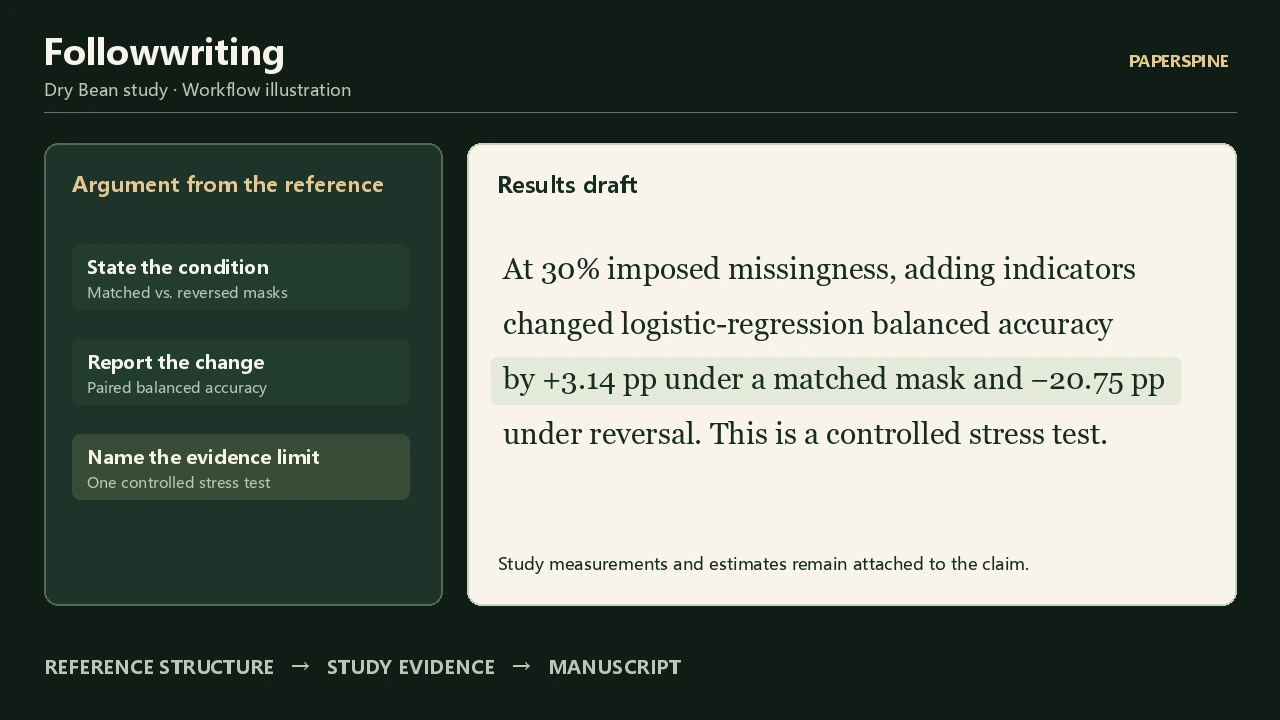
Given a research question and a public data source, the agent used UCI Dry Bean measurements to design a controlled missingness shift, compare two classifiers, and deliver the study with figures and an editable manuscript.

13,543 records after deduplication · 2,160 scored conditions

At 30% imposed missingness, adding missingness indicators changed logistic-regression balanced accuracy by +3.14 percentage points under a matched mask and −20.75 under a reversed mask. The shifts were imposed in the experiment.

Six panels showing the paired effects of missingness indicators for two classifiers at three imposed missingness rates.
Open vector figure

Implementation study · Three public datasets and one synthetic condition

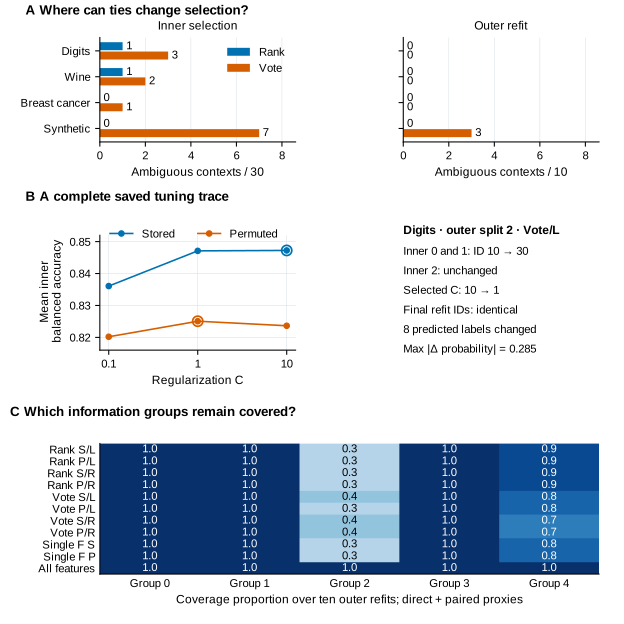
When the same features give different predictions

The agent traced feature selection through repeated nested evaluation and documented how a tie at the tuning boundary affected predictions.

10 outer splits per condition · A full saved tuning trace

In one Digits split, column order changed the tuned regularization from C = 10 to C = 1. The final selected feature IDs were identical, yet eight predicted labels changed.

Native three-panel figure showing ambiguous cutoffs, the Digits tuning trace, and group coverage.
Open vector figure

A paper you can audit

Check a claim, trace a plotted number, or pick up a revision from the files the agent has already saved.

Community

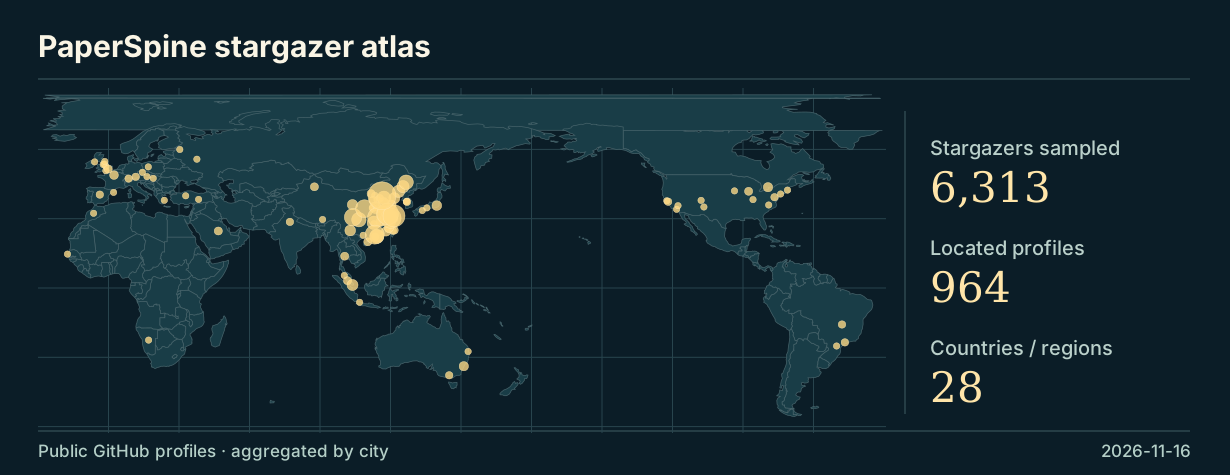
See who shipped each V6 update and what they changed, or explore the stargazer atlas.

World map of GitHub stargazer locations aggregated by city.